Render a chart from data
This recipe turns a plain data table into a bar chart inside the PDF, entirely server-side: a Lua block computes the chart geometry, serializes it as SVG, and embeds it via a regular <img> tag. No JavaScript engine, no headless browser, no external chart library.
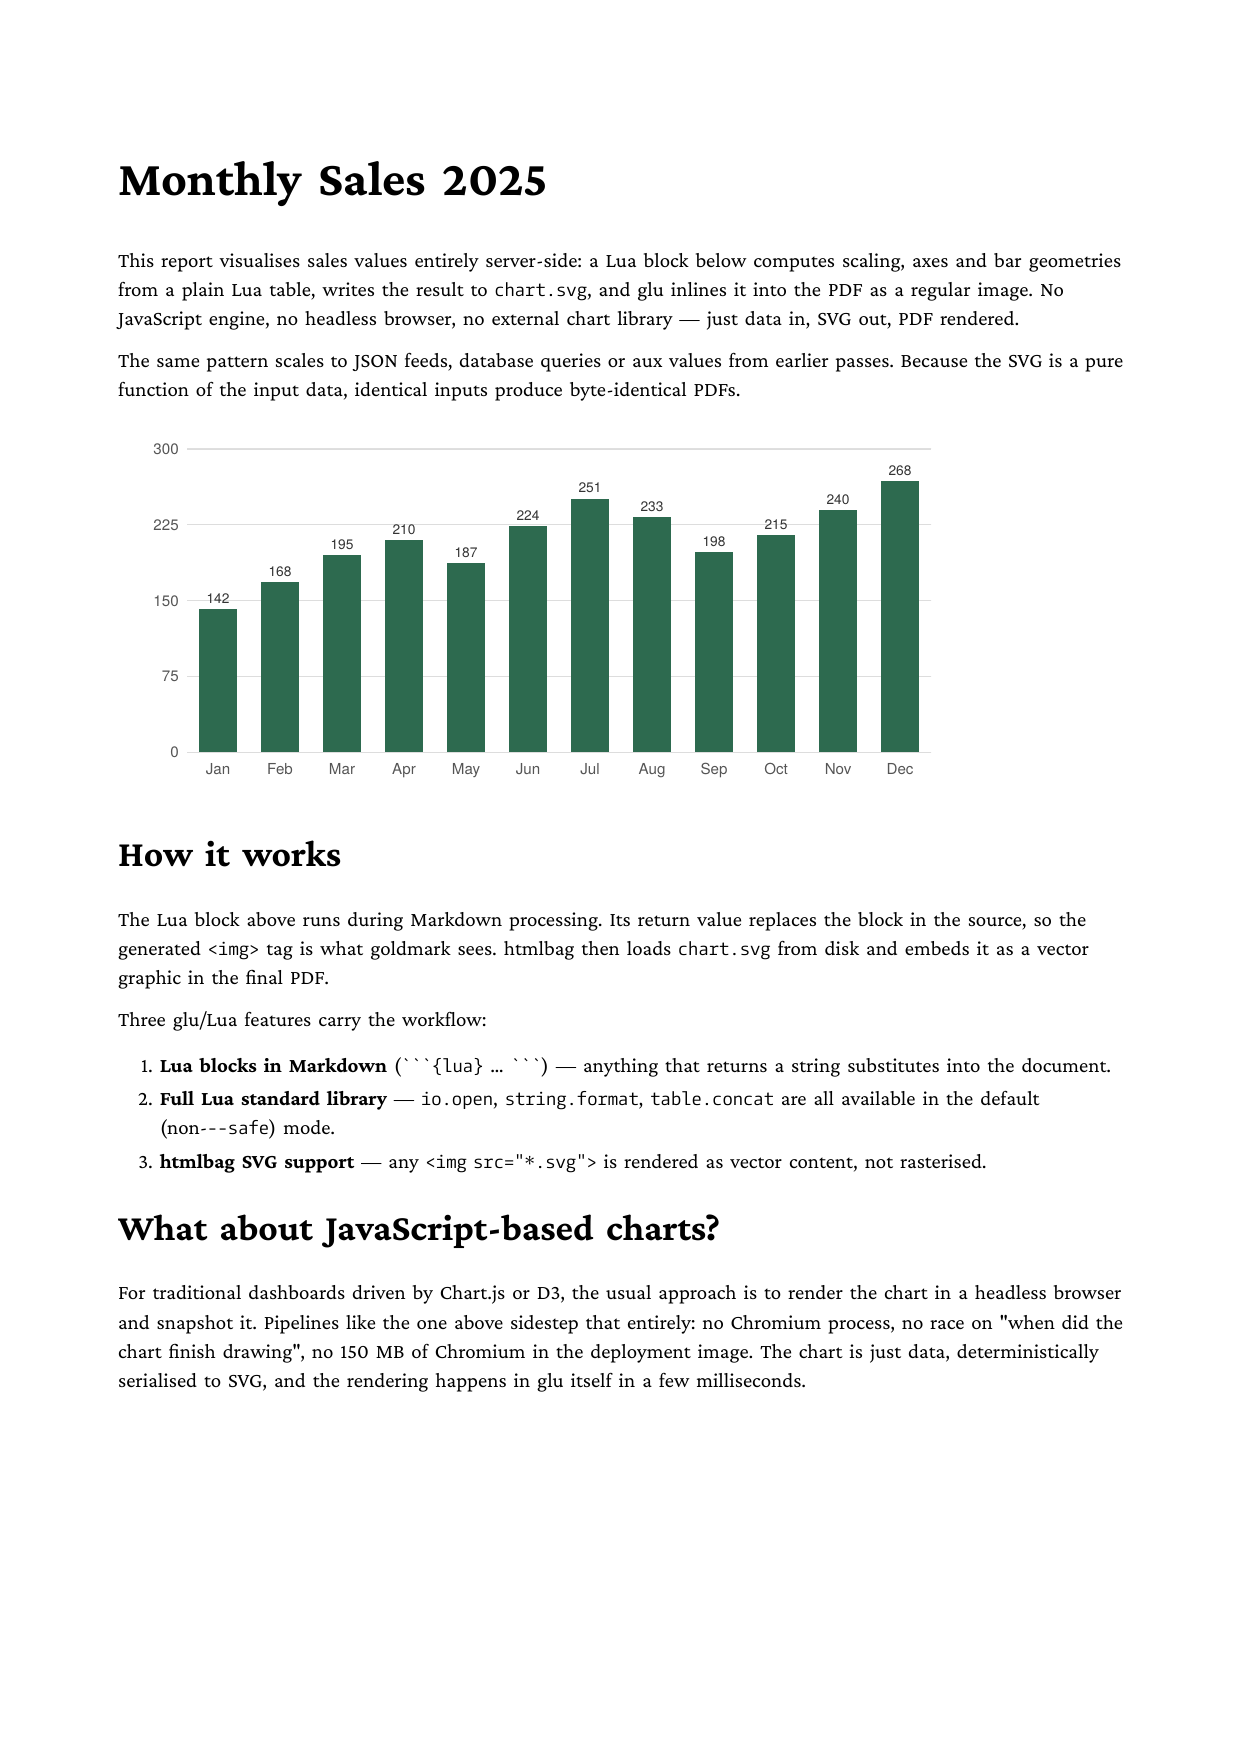
Full example: glu/markdown/chart-from-data
The idea
A {lua} block in the Markdown source runs during processing, and whatever string it returns replaces the block in the document. So the block can build an SVG from data, write it to disk, and return an <img> tag pointing at it. glu renders SVG images as vector content, so the chart stays sharp at any zoom level.
The Lua block
The full block in the example draws gridlines, axis labels, and value labels; this is the skeleton:
```{lua}
local data = {
    { month = "Jan", value = 142 },
    { month = "Feb", value = 168 },
    -- … one entry per bar …
    { month = "Dec", value = 268 },
}

local W, H = 600, 280
local parts = {
    string.format(
        '<svg xmlns="http://www.w3.org/2000/svg" viewBox="0 0 %d %d">',
        W, H),
}

for i, d in ipairs(data) do
    -- compute x, y, bar width and height from the data …
    parts[#parts + 1] = string.format(
        '<rect x="%.2f" y="%.2f" width="%.2f" height="%.2f" fill="#2D6A4F"/>',
        x, y, bar_w, h)
end

parts[#parts + 1] = '</svg>'

local f = assert(io.open("chart.svg", "w"))
f:write(table.concat(parts, "\n"))
f:close()

return '<img src="chart.svg" width="14cm">'
```
Three glu features carry the workflow:
- Lua blocks in Markdown: a block that returns a string substitutes itself into the document, so the generated
<img>tag is what the Markdown converter sees. - The full Lua standard library:
io.open,string.format, andtable.concatare all available. - SVG support: any
<img src="*.svg">is embedded as vector graphics, not rasterised.
Run it
glu chart-from-data.mdThis produces chart-from-data.pdf plus the side-effect chart.svg, which you can inspect or delete after the render. Because the SVG is a pure function of the input data, identical inputs produce byte-identical PDFs.
Extending the pattern
| Change | How |
|---|---|
| Read data from a JSON file | glu.json.decode(io.open("data.json"):read("a")) via the json module |
| Use values from a previous pass | Read _aux.your_key in the Lua block |
| Multiple charts in one report | Repeat the block and vary the output filename |
| Different chart type | Replace the bar geometry with line, area, or pie path computations |
Related
- Lua blocks in the Markdown mode reference
- glu.json module for reading data files